Station Annual Statistics -- Fernwood Elementary School
| Year | Minimuma °C |
Mean (Std. Dev.) °C |
Maximuma °C |
Count |
|---|---|---|---|---|
| 2018 | -0.4 | 12.1 (5.6) | 26.3 | 12 |
| 2016 | 0.8 | 11.7 (4.9) | 23.7 | 12 |
| 2012 | 2.3 | 11.7 (4.5) | 24.0 | 9 |
| 2021 | 0.1 | 11.2 (6.0) | 26.4 | 12 |
| 2019 | 1.5 | 11.2 (5.4) | 24.3 | 12 |
| 2015 | 1.3 | 11.1 (5.8) | 25.8 | 10 |
| 2020 | 2.4 | 11.1 (5.1) | 24.7 | 12 |
| 2014 | -0.1 | 10.9 (5.7) | 25.2 | 12 |
| 2017 | 1.0 | 10.8 (5.8) | 25.9 | 12 |
| 2013 | 0.4 | 10.0 (5.5) | 24.6 | 12 |
| 2022 | 2.2 | 10.0 (4.9) | 23.0 | 7 |
| 2007 | 0.9 | 10.0 (5.6) | 23.7 | 5 |
| 2010 | 2.8 | 9.9 (4.8) | 23.4 | 12 |
| 2009 | 0.2 | 9.8 (6.0) | 25.6 | 12 |
| 2008 | -0.5 | 9.3 (5.1) | 22.4 | 12 |
| 2011 | 0.2 | 9.2 (5.2) | 22.7 | 12 |
How are Annual Means Calculated?
Table rows are shown in descending order of Mean value.
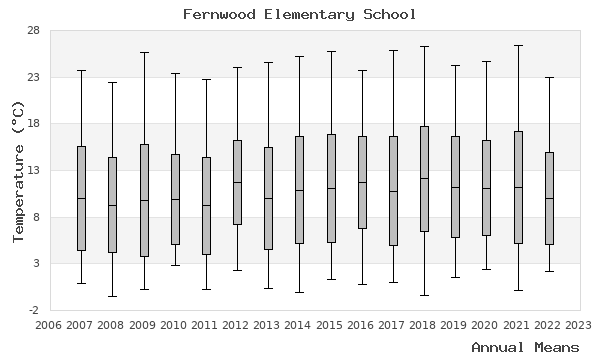
The table shows annual means for the selected station from each year in the database. Values are given in degrees Celsius. Averages shown here are calculated from monthly averages. The monthly averages are in turn calculated from daily averages. The value in parentheses following the annual mean value is the standard deviation of the monthly averages used to compute the mean. The minimum (maximum) is the minimum (maximum) of the monthly averages of the daily minimum (maximum) temperatures. In some cases the present data may be incomplete (shown as grey text). Use the Count column to determine if there is valid data for the entire year.
The values are plotted so that the minimum and maximum are marked at the end of the whiskers, the mean value is shown with a horizontal tick across each box, and the boxes show the range of plus and minus one standard deviation from the mean value.
a Note (as mentioned above) these columns are extremes of the monthly averages of these quantities. They are representative of the range of values observed throughout the year but are not the extremes themselves. The true annual extremes may be added in the future.

