Waves or Eddies?, 13 December 2003.
Further Comments
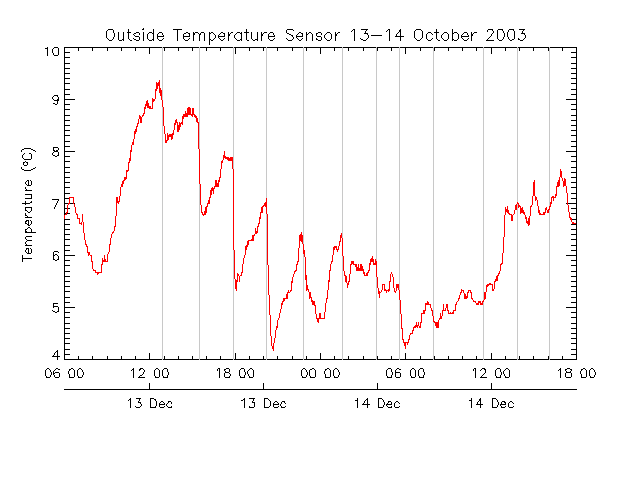
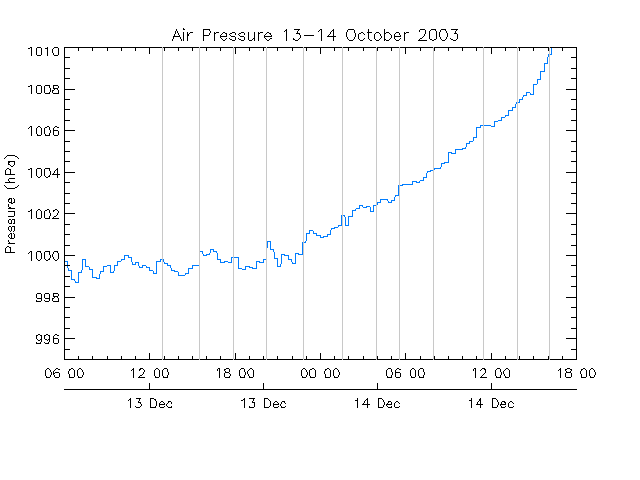
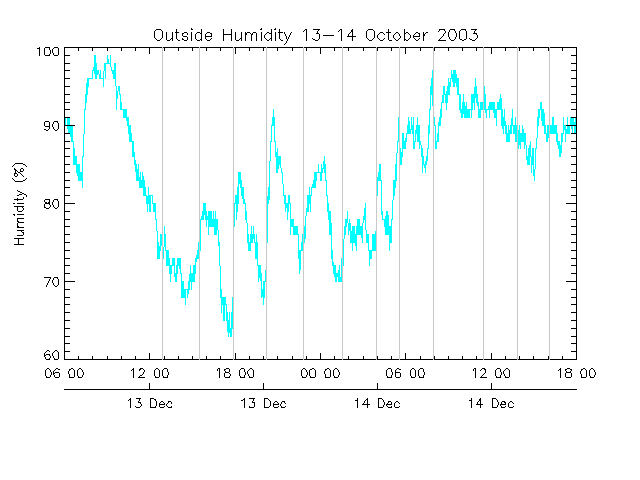
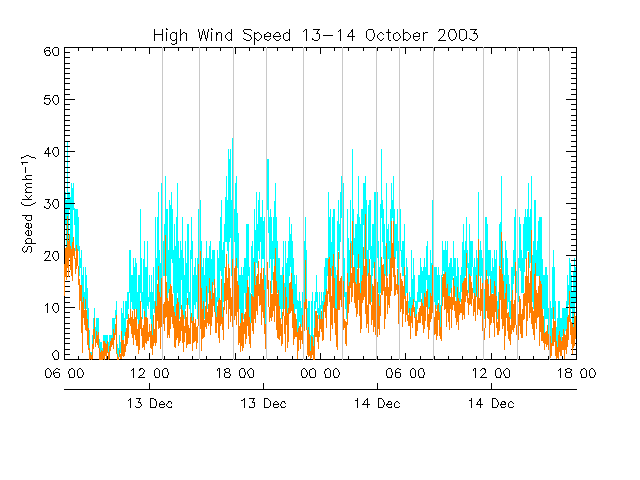
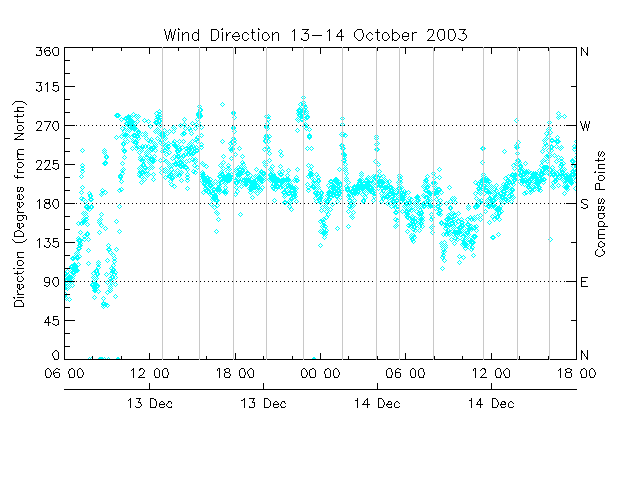
- The positions of the grey reference lines in each figure were mostly determined
by examination of the wind direction figure.
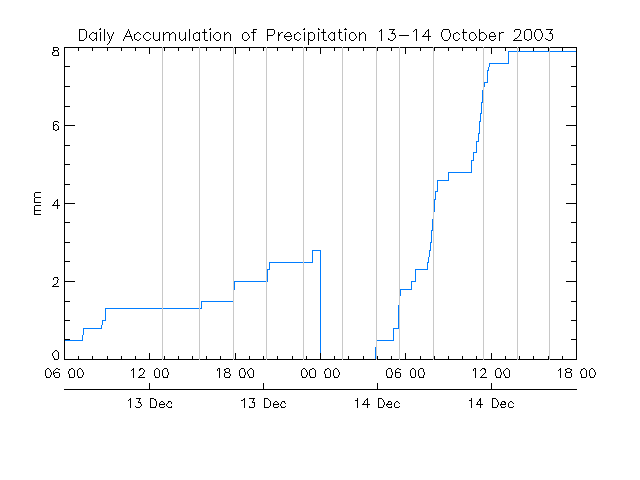
- The temperature drops correspond with these changes as does the rainfall.
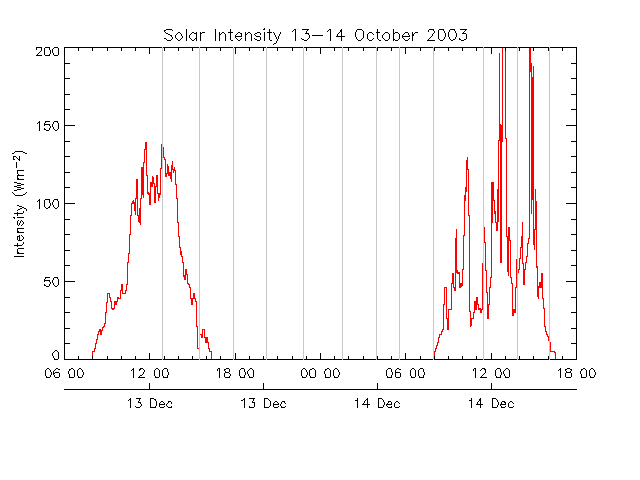
- Some of the peaks in wind speed sync up well.
- There seem to be small pressure increases that correspond to some of the wind
direction changes.
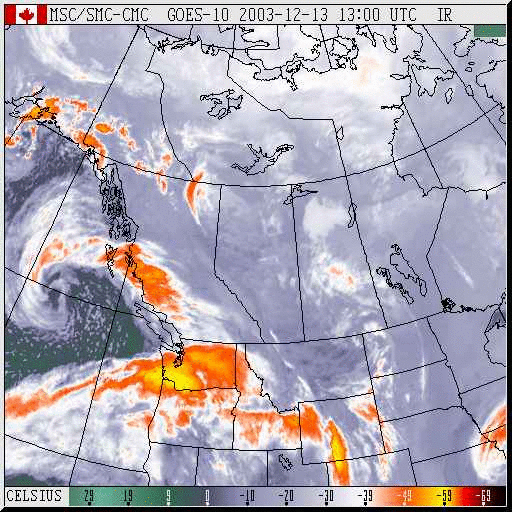
- There is an animated weather map of the time period below.
The times I've marked with grey lines are listed below (days from 00h 13 December 2003).
Below those are the differences (hours) between each marked line.
time 0.538 0.646 0.747 0.842 0.949 1.065 1.163 1.231 1.331 1.477 1.576 1.670 (days)
diff- 2.58 2.42 2.28 2.58 2.77 2.37 1.63 2.40 2.38 2.25 (hours)
erence
Here is the data.