Station Monthly Statistics -- Sir James Douglas Elementary School
April at Sir James Douglas Elementary School
| April at Sir James Douglas Elementary School | ||||
|---|---|---|---|---|
| Year |
Minimum °C |
Mean (Std. Dev.) °C |
Maximum °C |
Count |
| 2016 | 9.2 | 12.22 (2.0) | 16.4 | 30 |
| 2015 | 6.8 | 9.97 (2.1) | 14.1 | 30 |
| 2020 | 6.9 | 10.05 (2.0) | 13.8 | 30 |
| 2019 | 7.7 | 10.48 (1.7) | 13.8 | 30 |
| 2014 | 7.2 | 10.02 (1.8) | 13.7 | 30 |
| 2017 | 7.6 | 10.36 (1.7) | 13.6 | 21 |
| 2018 | 7.3 | 10.04 (1.7) | 13.3 | 30 |
| 2009 | 5.4 | 8.77 (2.2) | 13.0 | 30 |
| 2006 | 6.6 | 9.52 (1.8) | 13.0 | 30 |
| 2024 | 7.8 | 10.77 (1.2) | 12.9 | 17 |
| 2010 | 6.7 | 9.28 (1.7) | 12.6 | 30 |
| 2012 | 6.2 | 8.91 (1.8) | 12.3 | 17 |
| 2023 | 7.2 | 10.09 (1.3) | 12.3 | 30 |
| 2007 | 6.4 | 9.05 (1.7) | 12.2 | 30 |
| 2013 | 6.2 | 8.86 (1.6) | 12.2 | 30 |
| 2021 | 8.3 | 9.26 (0.7) | 11.0 | 2 |
| 2008 | 4.6 | 7.39 (1.8) | 10.8 | 30 |
| 2011 | 4.6 | 7.30 (1.7) | 10.6 | 30 |
| 2022 | 4.8 | 6.12 (0.9) | 7.8 | 4 |
| Means | 6.7 | 9.4 | 12.6 | |
How are Monthly Means Calculated?
The table shows values for the selected month from each year in the database. Values are given in degrees Celsius. Averages shown here are calculated from daily averages for the month. The value in parentheses following the monthly mean value is the standard deviation of the daily averages used to compute the mean. The minimum (maximum) is the average of the minimum (maximum) temperature observed on each day of the selected month. Table rows are shown by default in descending order of Mean value. Click on the column heads to change the ordering. In some cases the months may be incomplete. Months that have fewer than 24 daily values are shown in red. This may include the present month.
The last row in the table gives the averages of the columns. Click through the links in the column headers to sort by the different quanitities.
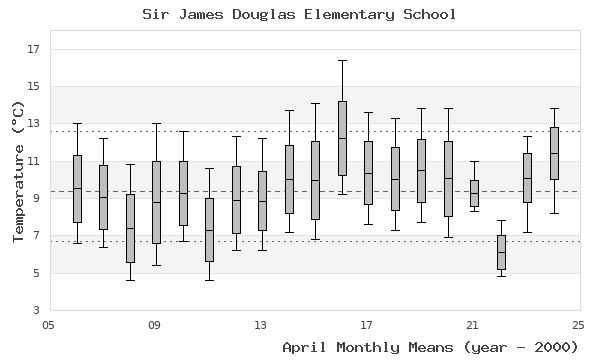
The values in the box and whisker plot are plotted so that the average daily minimum and average daily maximum are marked at the end of the whiskers, the mean value is shown with a horizontal tick across each box, and the boxes show the range of plus and minus one standard deviation from the mean value. The average of the daily average temperatures is shown with a dashed horizontal line and the average extremes are drawn with dotted lines.

