2024-02-15:

We're in the news: Funding dries up for Island's school-based weather network

Histograms of Average Temperature

Ray Watkins Elementary

See below for more information.

Select a category.

Select a location.

Year Histogram of Temperature at Ray Watkins Elementary
Winter Histogram of Temperature at Ray Watkins Elementary
Spring Histogram of Temperature at Ray Watkins Elementary
Summer Histogram of Temperature at Ray Watkins Elementary
Fall Histogram of Temperature at Ray Watkins Elementary

Description

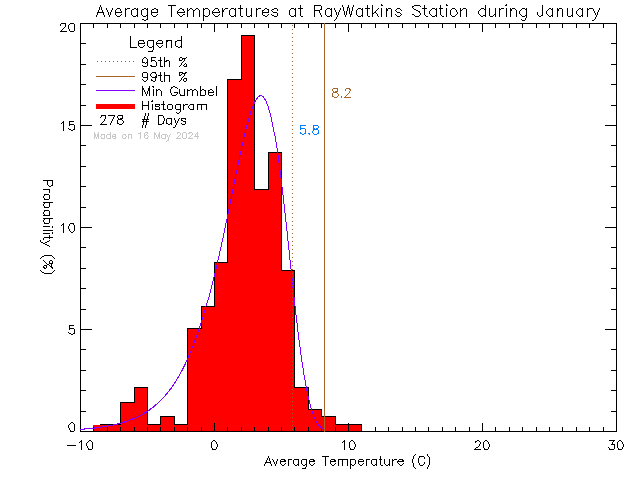
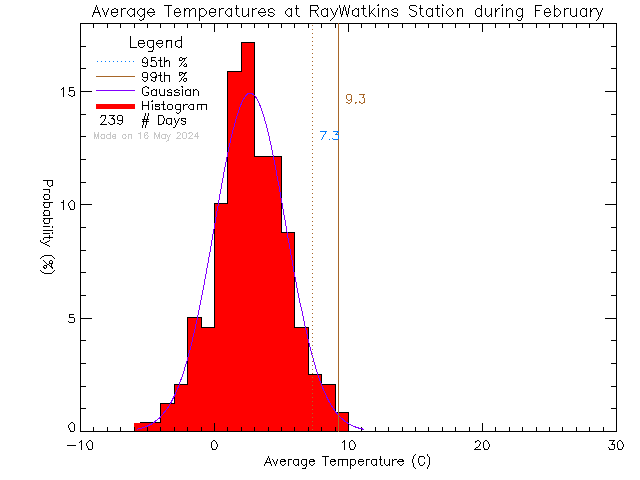
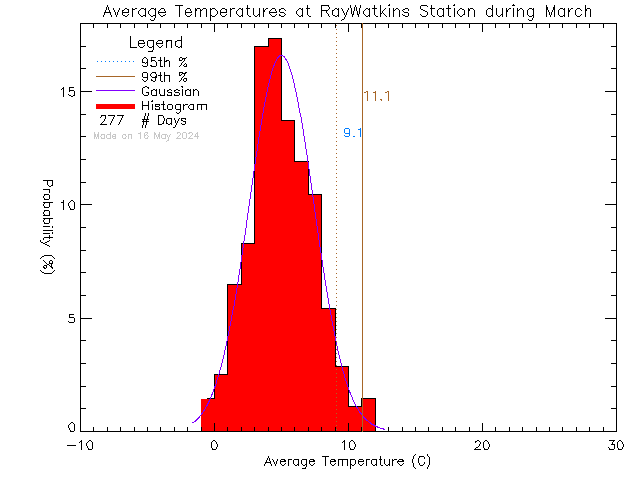
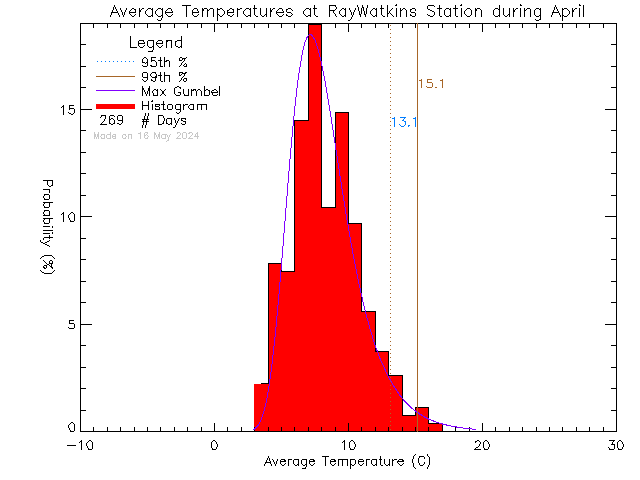
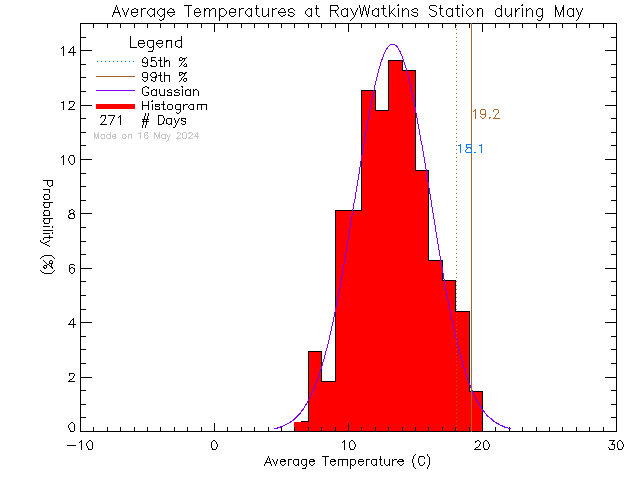
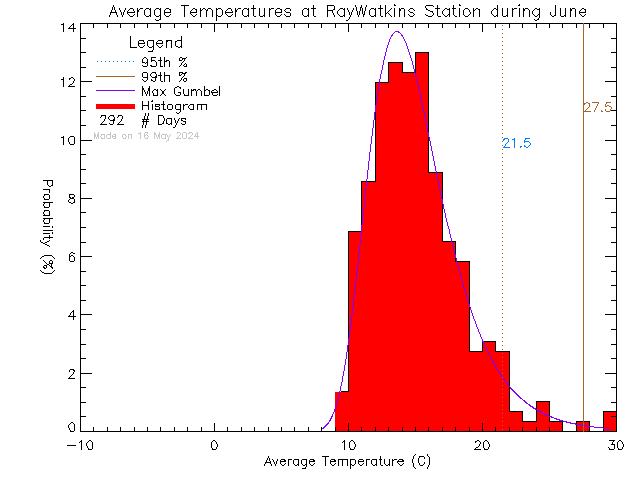
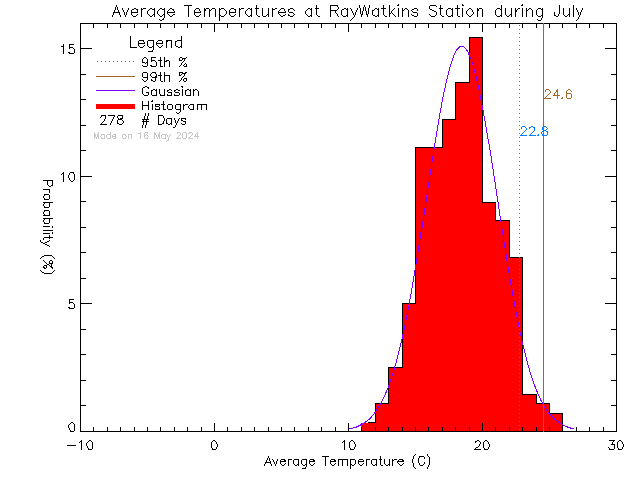
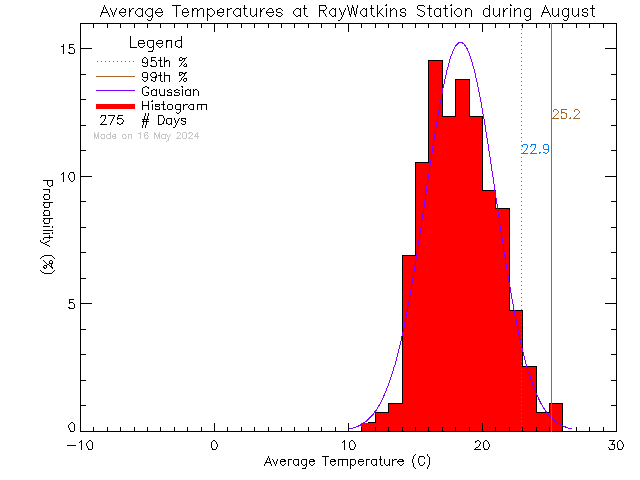
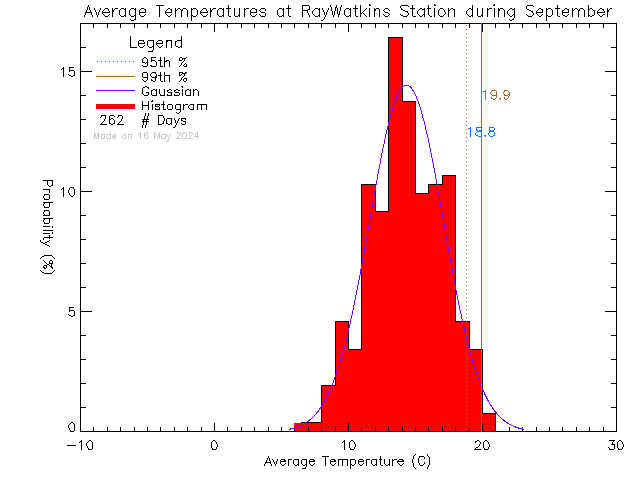
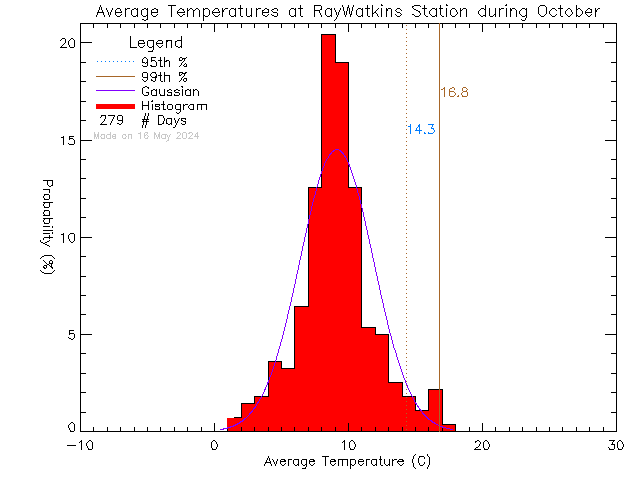
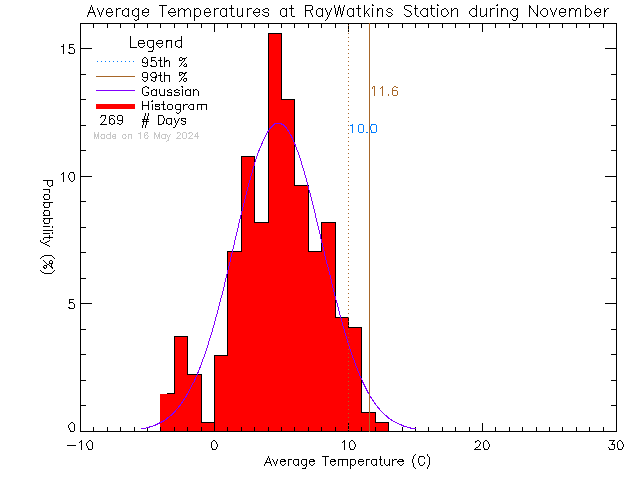
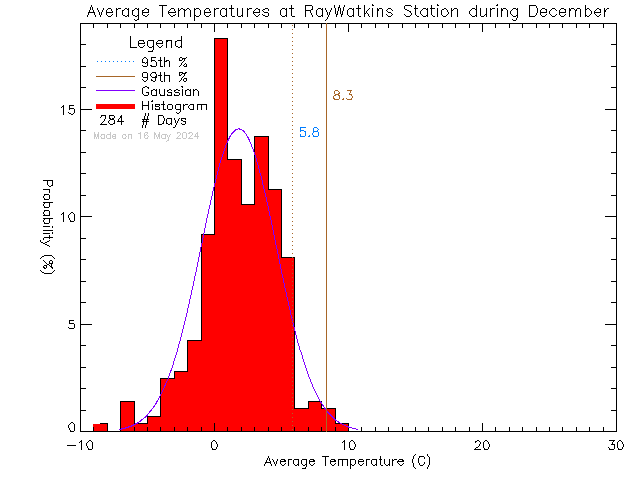
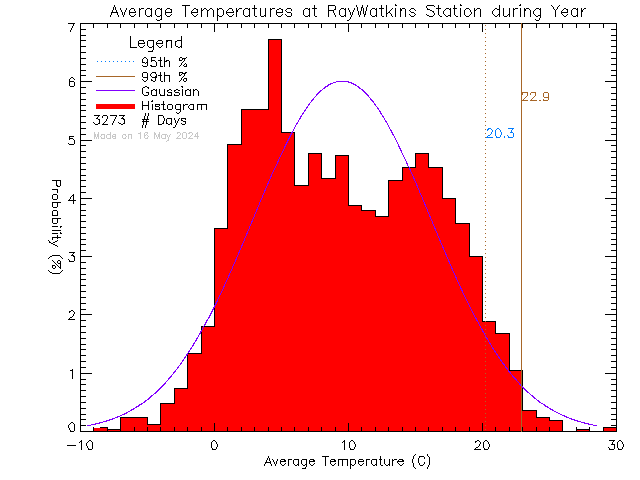
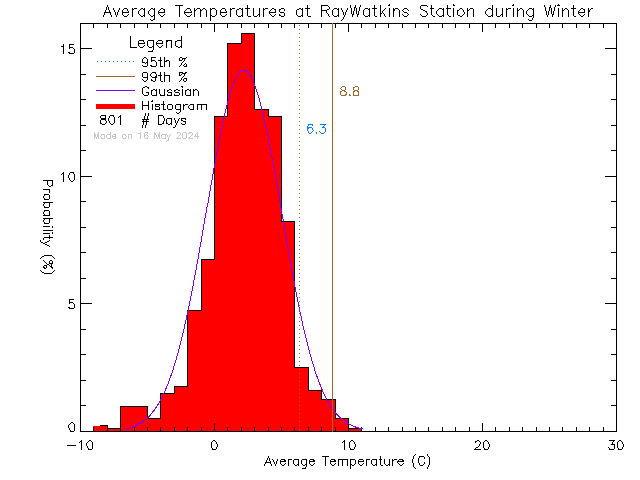
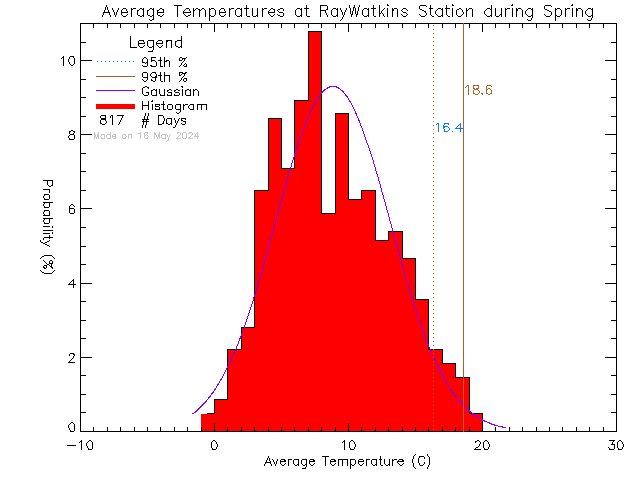
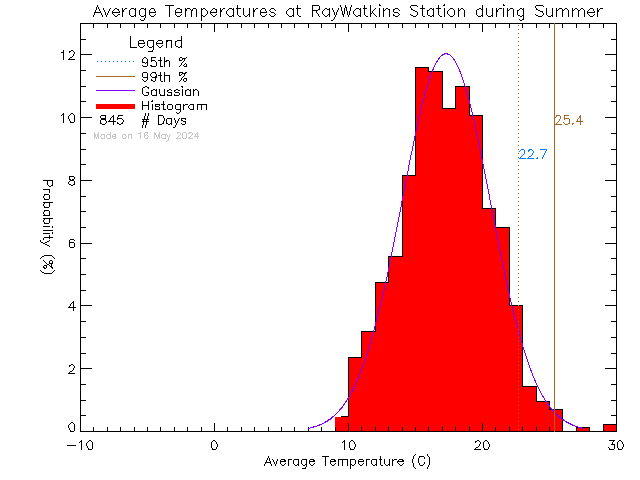
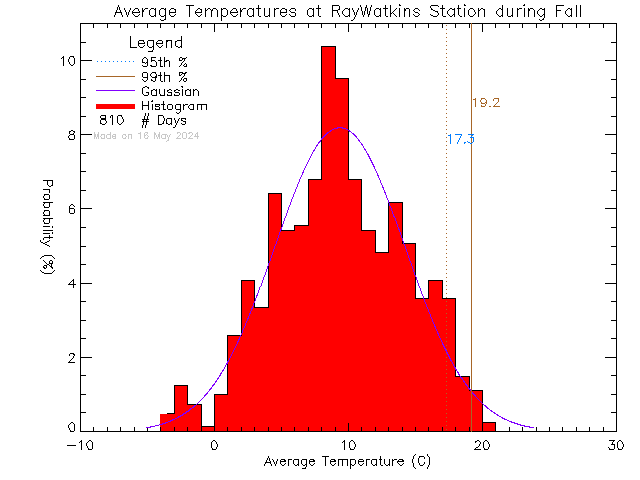
These plots show Probability Density Functions (PDFs) of daily average temperature at stations in the UVic School-Based Weather Station Network. The vertical red bars show a histogram of daily average temperatures. The data is fitted to one of three different probability distribution functions (Maximum or Minimum Gumbel and Gaussian), shown with a blue curve. The Gumbel distributions are appropriate for fitting sets of extreme values .e.g the set of maximum temperatures. We select the fit function with the least error.

The plots are shown for the entire year and for each season. We use the Meteorological Seasons, defined as follows:

  • Winter — DJF: December, January, February
  • Spring — MAM: March, April, May
  • Summer — JJA: June, July, August
  • Autumn — SON: September, October, November

Individual Months Are Shown Below

Fall Histogram of Temperature at Ray Watkins Elementary
This page took 6.1 ms to generate.

Disclaimer:

The Vancouver Island School-Based Weather Station Network is an education first project. Data from the network are made freely available as is to the public with no guarantee of accuracy or availability. Commercial use requires a license. Please contact Ed Wiebe, ecwiebe at uvic.ca for more information. This work (this site and all contents not otherwise attributed) by School-Based Weather Station Network is licensed under a Creative Commons Attribution-NonCommercial-ShareAlike 4.0 International License.
Creative Commons License

Valid HTML 5
Powered By UVic EOSC
Last Modified: March 28 2023 12:21:29.